Depending upon how close your data occurs in time, your chart can sometimes show long gaps along the time scale where there is
no information shown. This can make for a much wider chart than what might otherwise appeal to you.
Timeline Maker provides a very elegant solution called Insert Break. Using this feature simply removes an “empty” section
of the time scale, allowing more room for other events on the chart and creating a better overall visual layout. When you insert a
break it is very obvious that a portion of the time scale is missing (see below), and yet everything else on the chart remains in
context.
How Do I Insert a Break?
Click directly on the time scale in any “empty” area. If there is room for a break , then the area will be highlighted (see below).
Right click and select Insert Break from the menu.
This will create a visual break in the time scale as shown below.
Note: You can create as many time scale breaks as the chart will allow.
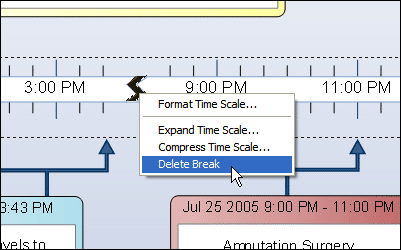
How Do I Remove a Break?
Removing a time scale break is even easier, simply right click on break (zig zag) and select Delete Break.
Test Drive this Technique
Test drive this solution by creating a new chart.
Create a test file with several events at one end of the time, ie year 2000, and also an event in 2005, finally including several events in 2010.
Create this chart by clicking on the Chart Tab.
You will be able to insert breaks to condense the timeline. Then consider expanding the scale as mentioned elsewhere in
this newsletter.