Specifying a Manual Date Range is a very useful way to select a firm start and end date/time for your time scale. Using this
feature overrides the usual automatic time scale created by default for a chart.
This time scale feature can be used to your advantage in several ways. For example, you can specify a narrow date range to show
only a subset of events on your chart. This is a very effective way to highlight a specific year, month or day. Specifying a
wider date range (beyond your event dates) creates space on the left and/or right side of your chart that can be used for
additional chart elements such as annotations and images, or use it simply for effect.
How do I know when I am using a manual date range for my time scale?
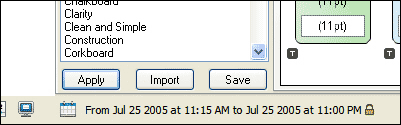
When a manual date range has been specified, you will see a "Lock" icon next to the date on the Status Bar. Until the date range
is changed (or removed by switching to Automatic) the start and end dates/times for your chart will never change.
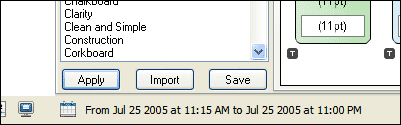
Automatic Timescale:
Manual Timescale:
Test Drive this Technique
To manually specify a date range for your time scale:
From the menu select Time Scale > Date Range or click on the Calendar Icon on the left end of the
Status Bar (see above picture).
Click on Manual and select the To and From dates and/or the times that you wish to be used for the chart.
Click OK.
Note: This date range is specific to this chart only. If you create a new chart it will have the "automatic" time scale by default.